My question is related to this_issue.
I’m using Cubit 2024, not configured with python. I’d like to draw a different mesh quality histogram in numbers of discrete color, and the range of colors. Can I export the mesh quality, say volumes, of all elements to a file so I can plot a histogram myself?
Hi @WayneYY,
cubit already got python included.
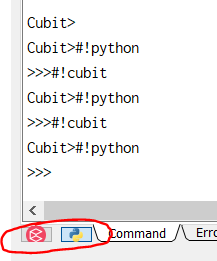
You can switch between cubit and python mode in the command line with
#!cubit
#!python
or with the buttons
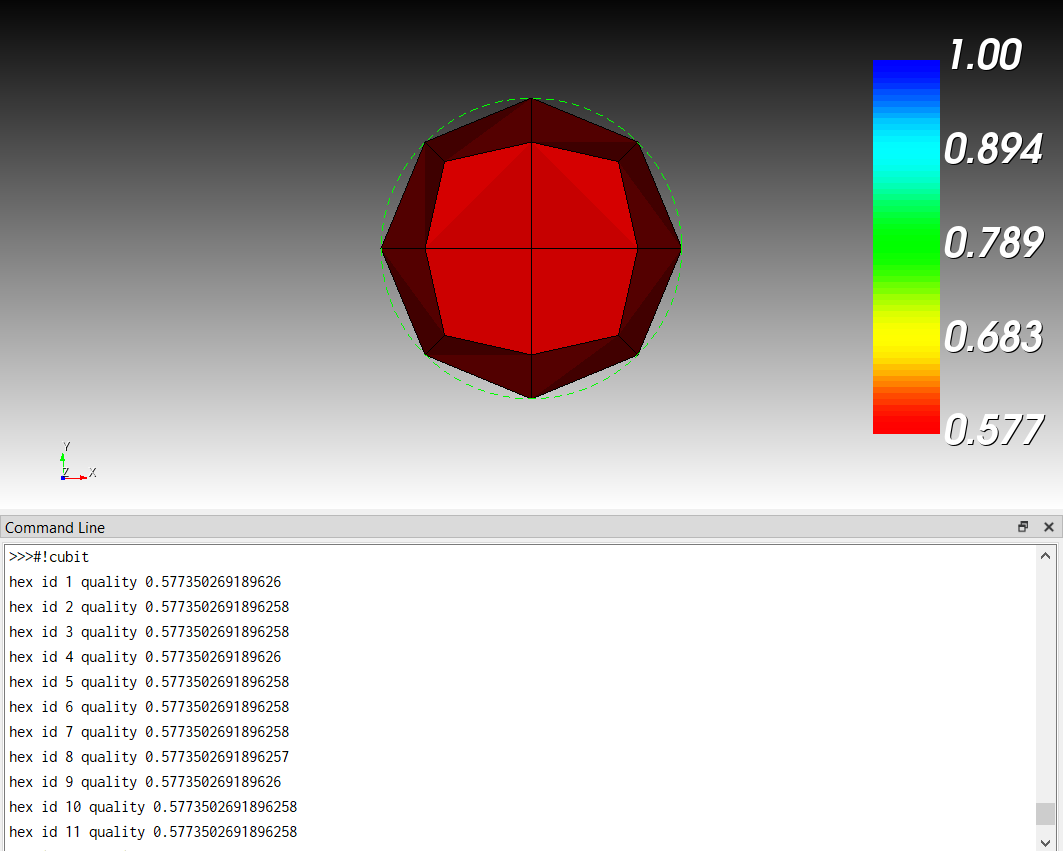
You can get access to the quality info from the elements through the python api.
Here a example using the get_quality_value() method.
#!cubit
reset
create sphere radius 0.5
vol 1 size auto factor 9
mesh vol all
#!python
hex_ids = cubit.parse_cubit_list("hex","all in vol 1")
quality_values = []
for id in hex_ids:
quality_value = cubit.get_quality_value("hex",id,"scaled jacobian")
quality_values.append(quality_value)
print(f"hex id {id} quality {quality_value}")
#!cubit
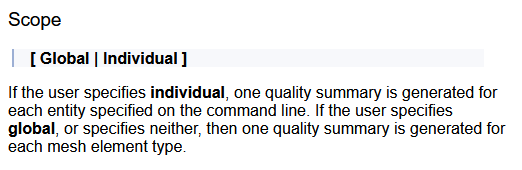
quality volume 1 scaled jacobian global draw mesh
Thank you Hofbauer ![]()
My color bar changed. Is the ‘global’ here doing the work?
The global keyword is used to define the scope of the quality summary output